
The Emotional Election: Measuring Appeal, Engagement and Empowerment
Political Communication
By Dr. Jon Morris and Peter Licari
Early in the presidential campaign, while late-night comedians have eviscerated Donald Trump’s bid as “all flair and no substance,” it did not seem to matter to voters. “Substance” is only one part of the equation. How people feel plays a huge role in how they respond to the candidates and their policies.
In fact, our previous work in emotional responses to communication showed that emotions are twice as good as raw facts in predicting behavioral outcomes. So in order to really understand people’s support (or disdain) for the candidates this election year, you have to understand people’s emotional responses.
Over the last several weeks, we conducted three online surveys aimed at measuring and understanding the emotional responses to Donald Trump and Hillary Clinton and key issues facing the country. The composition of all three surveys were matched to those of likely voters. For some additional context, the first survey was administered immediately prior to the first debate and the second began collection before the second debate and finished a couple of days after. The third was administered Nov. 1 and 2.
Clearly, there are a lot of feelings at play this year — and not particularly positive ones either. A FiveThirtyEight analysis in May argued that Trump and Clinton were the least positive candidates for as long as reliable polling has existed in the United States. Period. Gallup surveys on candidate favorability tend to also paint relatively unflattering paintings of candidate support.
This assertion is supported by our results as well. On a 9-point scale, with 1 being the strongest feelings of negativity and 9 being the strongest feelings of positivity, Trump scored an average of 3.5 on the first wave, 3.3 on the second and 3.6 on the third. Clinton was viewed with statistically greater positivity but was still seen as more negative than positive, generally. She scored a 3.8 on the first survey, 4.4 on the second and 4.1 on the third.
So do these scores mean that people feel near equal levels of disapproval (verging on opprobrium) for both candidates? That this is really a case of people largely voting for the “lesser of two evils” or against a candidate as opposed to for one?
Not exactly. Although favorability is often a really strong proxy for emotion, that single way of understanding how people feel fails to get at the emotional undercurrents driving this election.
Depending on who you ask, there are a number of different dimensions needed to accurately describe emotion. We use AdSAM® (a visual measurement system used in both academic and private sector research that converts responses into descriptions of emotion), which consists of three dimensions: Appeal, Engagement and Empowerment. Appeal describes how positively or negatively you feel towards a subject; it’s the most common way that surveys conceptualize emotion. Engagement pertains to how captivated you are and how invested you feel. Empowerment relates back to the concept of locus of control — how in control we feel regarding the situation being presented.
When we look at the election using these three measures, we get a much richer understanding of how people are feeling. Last year, for instance, we showed that Trump was able to convert fear into anger which translates into an increase in Empowerment. His appeal in the primaries came not from defusing negative emotions but in translating them on a different emotional axis. One that made people feel more in control in an uncertain world.
The emotional foundation of the country ostensibly seems primed and ready for the continuation of such a strategy. By and large, people find themselves feeling unhappy or dissatisfied with the state of many political issues. Using the same three-dimensional scale on a range of issues including Black Lives Matter, The Affordable Care Act, Gun Control, Education, Economic Outlooks, Immigration and the Islamic State, we see that the electorate as a whole is largely suspicious, troubled, irritated or fearful. The most Appealing and Engaging out of the 30 total items we measure are Prospects of a Female President, Legal Abortion (A Woman’s Right to Choose), Universal Healthcare and Employment Potential.
However, in the general election, Trump’s strategy is not paying off nearly as well — at least until this week. An emotional response measurement taken on Nov. 1 and Nov. 2, showed that the FBI letter and Trump’s effort to discredit Clinton have had an effect, particularly among the 45-to-54 demographic. Except for this age group, in the latest measurement just seven days before the election, the negativity generated by Trump, in contrast, is much more likely to result in feelings of alarm, fear or terror. That is not to say that Trump isn’t generating any skepticism or ebullience as opposed to fear or that Clinton is not generating alarm of her own. Rather, on the whole, our respondents, except for those 45–54, were much more likely to feel alarmed towards Trump than Clinton.
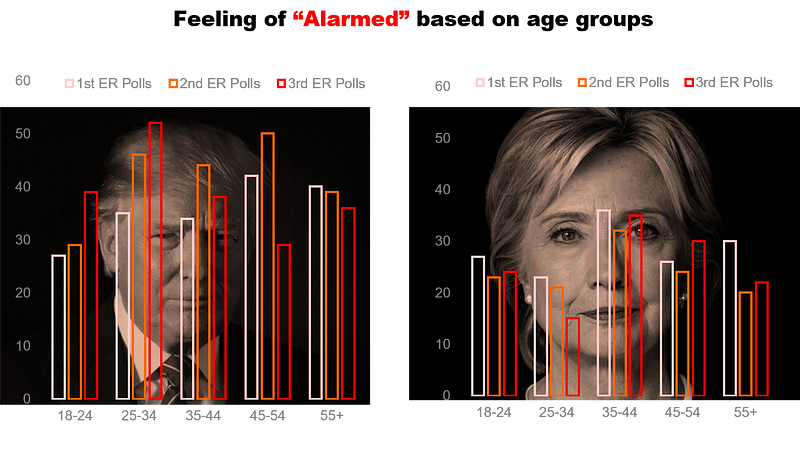
In the third survey, 39 percent of those 18–24 (29 percent in the first survey and 27 percent in the second) are alarmed about Trump while 24 percent (27 percent in the first survey and 23 percent in the second) feel that way about Clinton. This is the closest gap that exists on this metric. Although more individuals in the 35–44 age demographic felt alarmed about Clinton than Trump in the first wave (34 percent vs 36 percent), the difference reversed dramatically after the second debate, but became almost even during the last week before the election.
The greatest disparity is in the 25–34 age group where 52 percent feel alarmed about Trump and only 15 percent feel that way about Clinton. In essence, Trump is not able to transform negative feelings into those that increase Empowerment in most age groups and this inability comes at his detriment.
One of the questions we had going into the study was how much of this election was about the people affirming “the lesser of two evils.” So we asked our respondents if they saw themselves as voting for someone as opposed to voting against someone. Across all surveys, roughly 54 percent of respondents said that they were voting against one as opposed to for the other.
We were wondering what kinds of emotions were driving these feelings. Was it in how far both candidates are from how respondents would ideally like to feel about the candidates? Was it in how people felt about the Republican and Democratic parties? Is it in how people are emotionally responding to the candidates’ policy outlines? Or is their just a general sense of cynicism in the United States?
By and large, we find that people’s attitudes toward the candidates’ policies are having some of the strongest effects and these results follow the pattern that one would typically expect. If a respondent feels more positively about these policy ideas, they are more likely to indicate that they are voting for a candidate. That is not to say that this large proportion of people voting against is not a part of the times. At the same time, there is indeed a general sense of cynicism pervading the electorate which are influencing these rates, too.
However, after having controlled for all of these variables, we find something rather interesting. Our results show that Trump’s distance from the ideal is not significantly related to people’s decision to vote for a candidate. But Clinton’s is. In fact, the further Clinton is from the ideal, the more likely an individual is to report voting against her. There is a similar story to be found in the results of party identification; people’s feelings towards the Republican party weren’t significant but those towards the Democrats were. The more negatively people felt towards the Democrats, the more likely it was that they would indicate that they were voting for the Republican candidate.
Although it is far too early to draw any definitive conclusions, if we take the breakdown of how people’s vote choice relates to their decision to vote for or against, and if we consider the events surrounding this election, we are able to make a solid inference at what these results are saying. Our hunch is that Democrats who find themselves distant from Clinton policy-wise are indicating that they are voting against Trump while Republicans are using Clinton’s distance from their ideal to indicate that they are voting against her.
However, all of the controversies surrounding Trump and his political stances are making it difficult for Republicans to say that they are voting for him. Instead, they may be relying on their distance from “the partisan other”, the Democratic Party, in motivating their decisions to affirm him. It may be a contest where one part of the electorate is rallying against an ideological out-group as opposed to feeling enthusiasm for their candidate.
That is not to say that there is absolutely zero enthusiasm towards either candidate. Quite the contrary, a sizable plurality of people do harbor favorable positions towards the candidates.
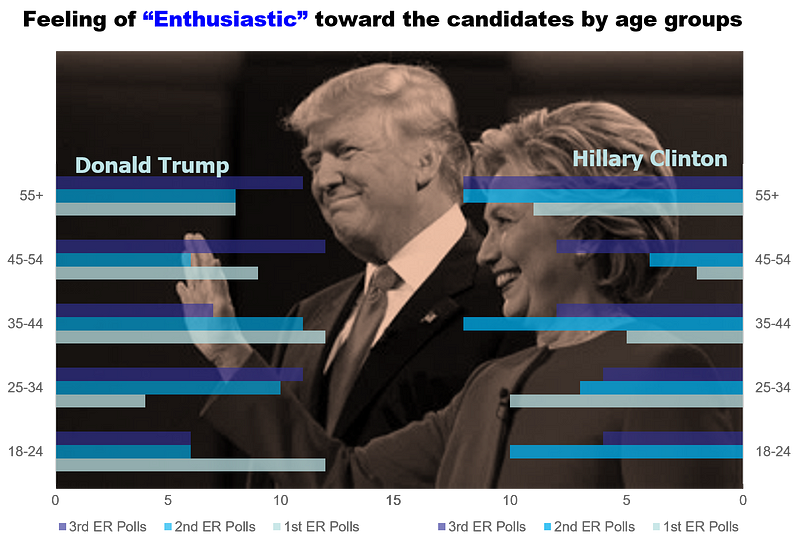
The demographics of the enthused have shifted in the course of the election, to the point that they are nearly even. But Clinton’s most difficult categories tend to be 25–34 and 45–54 year olds. In fact, prior to the first debate, no respondents between the ages of 18 and 24 gave responses consistent with enthusiasm for Clinton. After the second debate, though, a great deal of the youngest and oldest respondents indicated that they were enthusiastic about Clinton. Most of the consistently appealing responses for Trump arise from the 45-to-54 group while Clinton is stronger in appeal among all other age groups, particularly the 25–34 and 55+ demographics.
By and large, across all age groups, in the last week before the election, Clinton is seen as more appealing than Trump (Clinton 30 percent vs. Trump 22 percent). If we consider this strength in tandem with the other emotions that we observed, anxiety, fear and alarm are more strongly associated with Trump than Clinton.
Although Clinton is generating more positive and engaging emotions overall than Trump, the percent who find either one appealing — in any age group — never exceeds 39 percent. This is a fact that may be lost when we only look at common measures of emotional support but emerges from a more multifaceted approach to the concept. If emotion and behavior are as strongly linked as we suspect, then, at this point, it remains Clinton’s race to lose.
Jon Morris, Ph.D., is professor of Advertising at the University of Florida College of Journalism and Communications. Peter Licari is a doctoral student at the University of Florida Department of Political Science.
Posted: November 7, 2016
Insights Categories:
Political Communication